Volcanos Data TidyTuesday
This is my contribution to TidyTuesday
In this, I’m attempting to use the gganimate package for the first time to create an animation showing volcanoe eruptions over the past century and their location.
Packages used for this document:
    library(readxl)
    library(tidyverse)
    library(ggplot2)
    library(gganimate)
    library(maps)
    library(ggthemes)
    library(DT)
    library(gifski)
Lets take a look at the data first and see what information is here.
    eruptions <- readr::read_csv('https://raw.githubusercontent.com/rfordatascience/tidytuesday/master/data/2020/2020-05-12/eruptions.csv')

    eruption_list <- eruptions %>%
      janitor::clean_names() %>%
      select(-contains("modifier"), -contains("uncertainty")) %>%
      filter(eruption_category == "Confirmed Eruption") %>% #only confirmed volcanoes stay in data
      drop_na(end_year) %>% #drops those without end year
      filter(end_year > 2010) #filters only volcanoes after 2010

    datatable(eruption_list, rownames = FALSE,
              options = list(pageLength = 5))
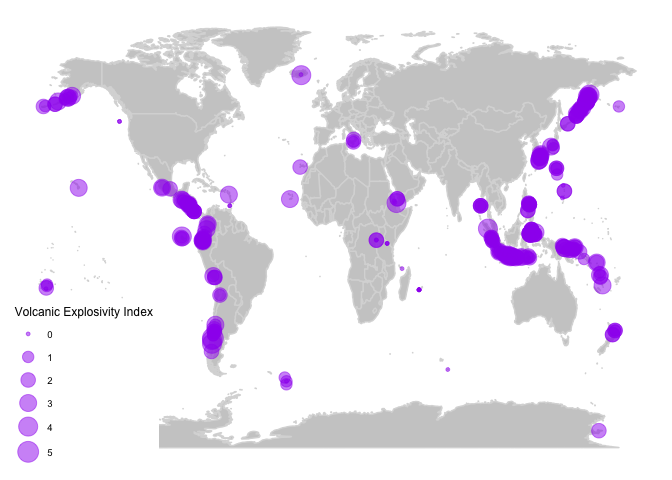
Next, I’ll create an underlying map for plotting the points.
    world <- ggplot() +
      borders("world", colour = "gray85", fill = "gray80") +
      theme_map()

    map <- world +
      geom_point(aes(x = longitude, y = latitude, size = vei),
                 data = eruption_list,
                 colour = 'purple', alpha = .5) +
      scale_size_continuous(range = c(1, 7)) +
      labs(size = 'Volcanic Explosivity Index')

    map
Now let’s animate! I did not realize going into this that the points would ‘move’ from year to year instead of appearing for that year then disappear. Something to consider for the next time I use this package.
animate2 <- world +
    geom_point(aes(x = longitude, y = latitude, size = vei),
             data = eruption_list,
             colour = 'purple', alpha = .5) +
  labs(title = "Date: {frame_time}", size = "Volcanic Index") +
  transition_time(end_year) +
  ease_aes("linear")

animate(animate, renderer = gifski_renderer("volcanobyyear.gif"))
Steven DiFalco
GIS and Land Data Manager
My interests include botany, geography, human dimensions, and landscape ecology.