This is the second post to using the Urban Ranger Response Call from NYC Open Data first post. The data did not have specific location information, such as XY coordinates, but there was a field Property in the database. Using this field, I decided to try out geocoding the information in ArcGIS Online.
To start, let’s read in the data. In viewing the first 10 rows, I already see we might have some cleaning needed for this column also. “WashingtoM” vs “WashingtoN” Square Park.
#Note, this first csv has been cleaned as part of the first post, so see that part to check what has been changed already from the original dataset.

data_raw <- read.csv("UrbanRangerDataClean.csv")

#Calls by property
head(data_raw$Property, n=10)
##  [1] Washingtom Square Park       Van Cortlandt Park
##  [3] Irving Square Park           Parade Ground
##  [5] Silver Lake Park             Washington Square Park
##  [7] Tompkins Square Park         Tompkins Square Park
##  [9] Flushing Meadows Corona Park Flushing Meadows Corona Park
## 194 Levels: 5 East 102nd St 851 Fairmont Pl Abingdon Square ... Wolfe's Pond Park
I decided to try out using Open Refine to clean up the data instead of trying to use R. Open Refine simplifies the process of finding text that are close to one another and allows for easy cleaning. Follow videos on their webpage to get the data_raw.csv file uploaded if you want to follow along.
Using the Facet feature on the Property Column, we can group together like text. Using Cluster and Nearest Neighbor function, we get the pop-up below. I went through different types of clustering to merge similar properties names together. I also did the step above for species.description and animal.class to refine these columns. Last step, add a column for State and put New York for all entries- reason will be clear below. Export this csv file.

Now to bring this over to ArcOnline to geocode! But one final step is needed first; creating a layer which allows ArcOnline to query location names for geocoding. I followed this tutorial to make one for the United States.
To a new map in ArcGIS Online, add the cleaned data and you will get a popup that looks like this:

Change “Location Field” to State= State and Property = Location or Place.

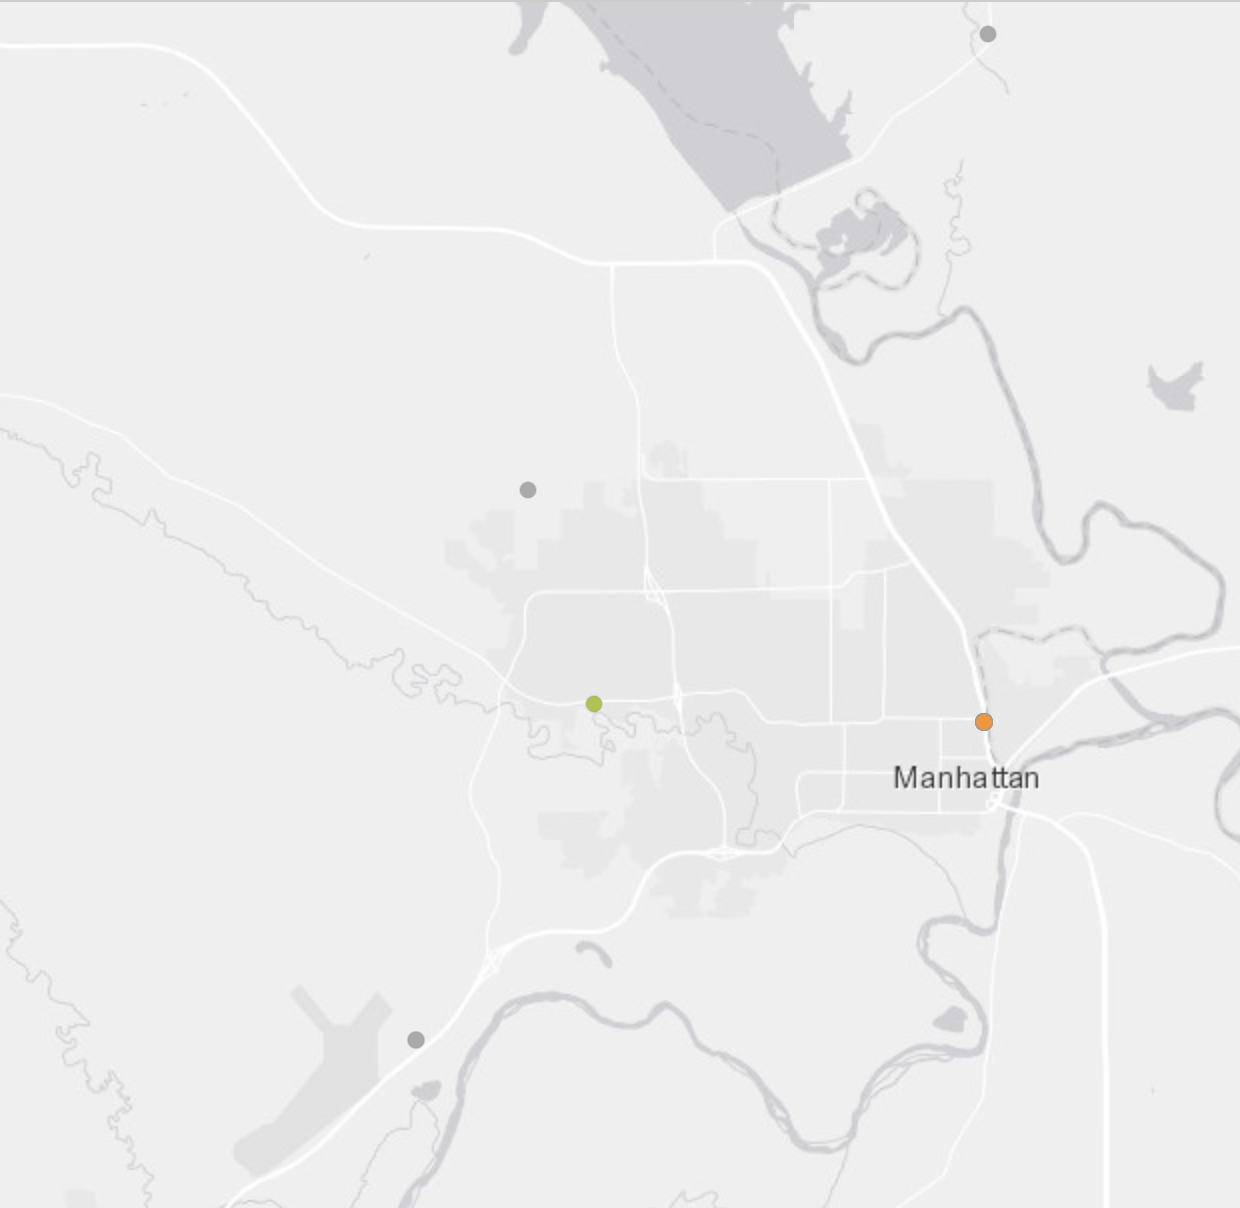
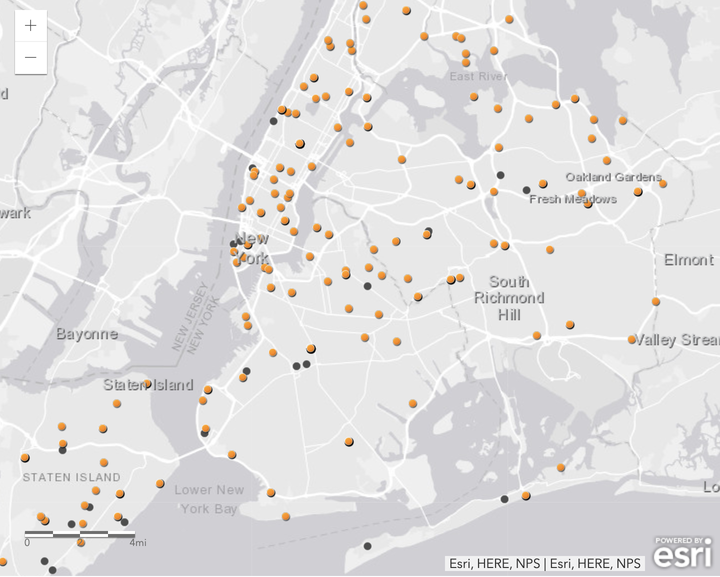
Here is the current online map to explore. Orange in this map indicate points with the state field, vs those without state field.
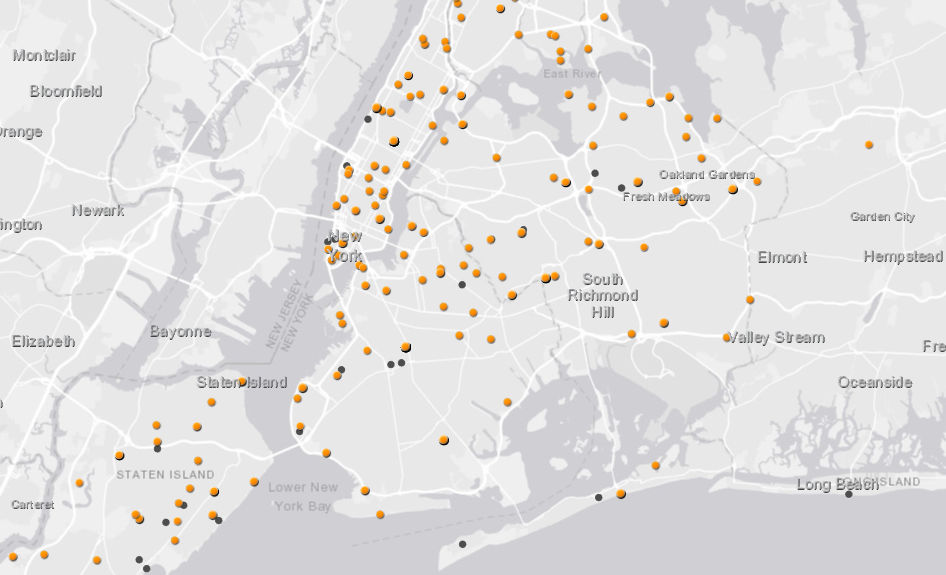
 Geocoded Points